Visualization of Top8000 Protein Dataset
Visualization of Top8000 Protein Dataset#
These materials were assembled for the ASBMB conference Teaching Science with Big Data workshop titled Visualization of Top 8000’s Protein Dataset. These materials are released under the CC BY-NC-SA 4.0 license. This Jupyter Book presents completed versions of the activity, but blank versions of the Jupyter notebooks are available using the download links below.
This activity requires an installation of Python, Jupyter, and the NumPy, matplotlib, and biopython libraries. All of this software is freely-avialable and runs on all major computer operating systems. For instructions on installing this software, see Chapter 0 of the free Scientific Computing for Chemists with Python book.
The goal of this activity is to provide the participant with experience using Python and Jupyter notebooks to process and visualize large amounts of protein structural data. This activity is broken down into three notebooks with the specific goals provided below.
Familiarize participants with Python, Jupyter, plotting data, and using Python functions
Extract information from PDB files and visualize it using Python and matplotlib
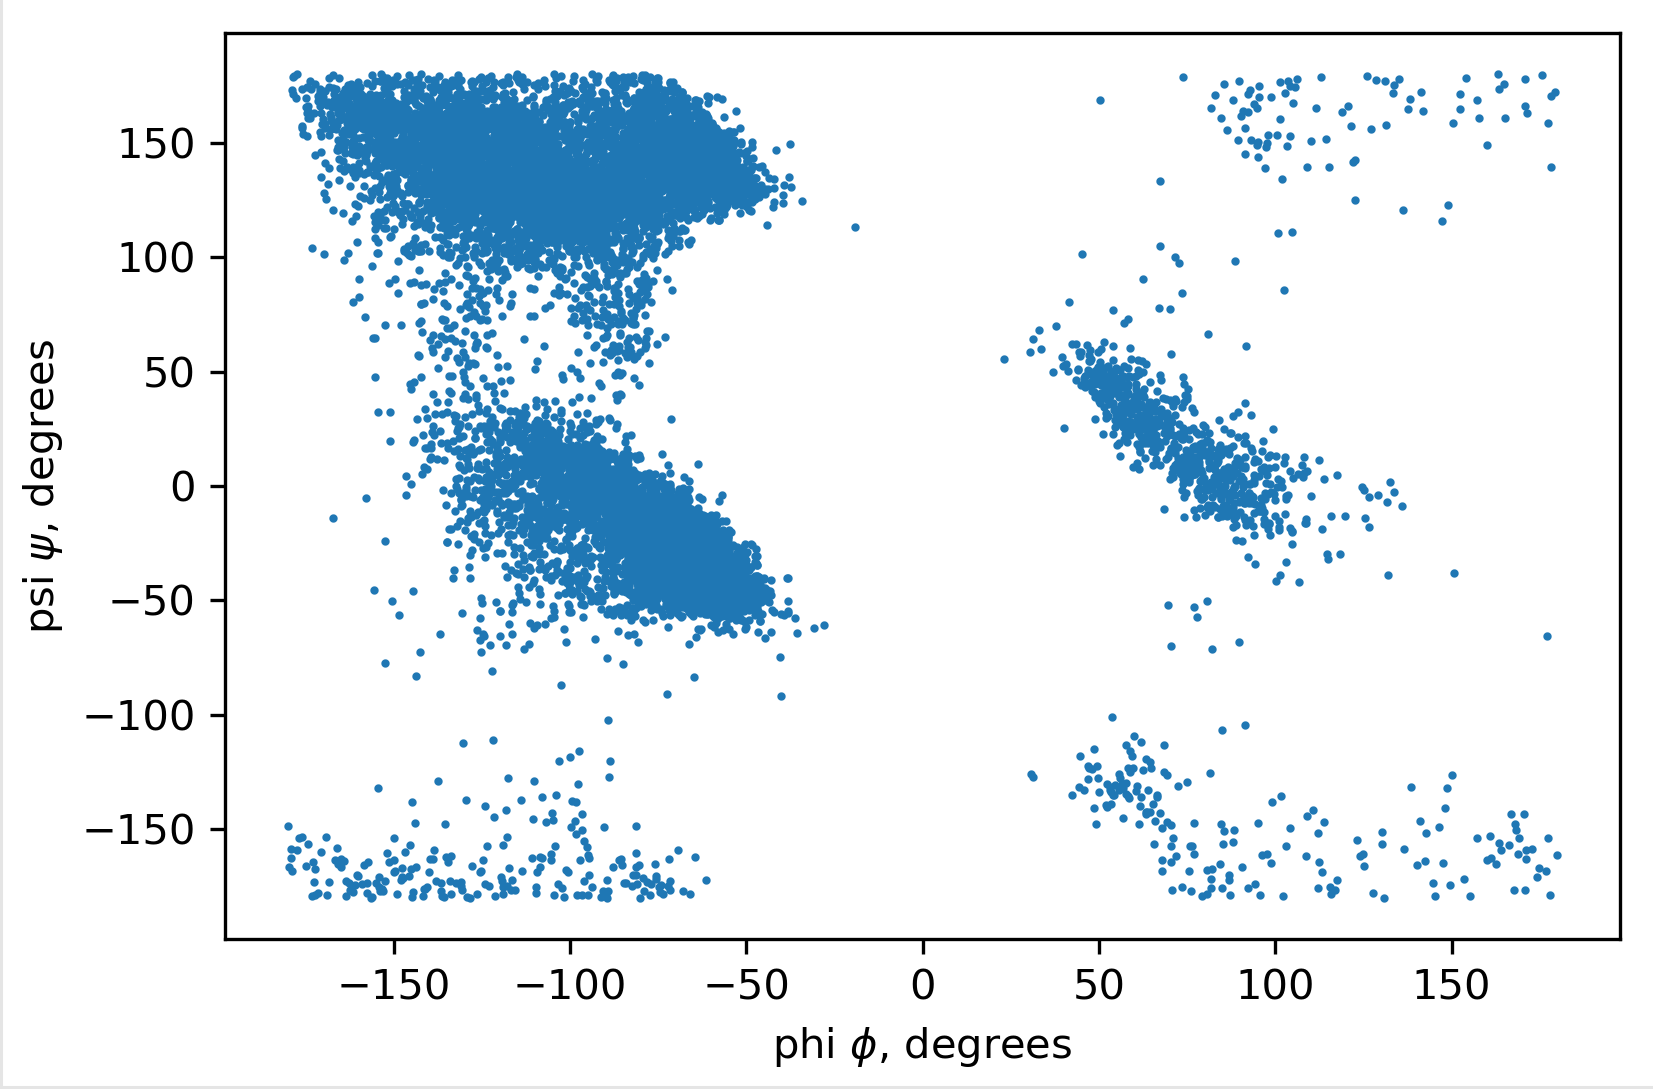
Examine bond angle data from multiple proteins and visualize it including generating Ramachandran plots and examing how secondary structure affects dihedral angles

This activity only uses a small subset from the Top8000 dataset, included below, due to time restriction. The full dataset has since become unavailable and is replaced by the top2018 dataset. This activity can be used with any collection of quality protein PDB files and does not inherantly require the above datasets. The RCSB PDB Protein Data Bank is a great source of protein data for those intersted in assembling their own data sets.
Download Completed Jupyter Notebooks
