Notebook 0: Visualization of Top8000 Protein Dataset
Contents
Notebook 0: Visualization of Top8000 Protein Dataset #
The overarching goal of this workshop is to introduce you to running Python in Jupyter notebooks and using biopython to extract and visualize information from PDB files. This workshop is broken down into three Jupyter notebooks delinated below. This is by no means intended to make you procient in writing your own code, but it rather intended as a chance for you to get comfortable with Jupyter notebooks and to run Python code to visualize protein data.
Top8000 Protein Dataset #
This activity will focus on analyzing the Top8000 Protein Dataset which is comprised of ~8000 high quality protein crystal structures stored as PDB files. In this activity, we will using the above mentioned tools to examine trends in the protein structures. Because extracting information from this dataset often takes 1-20 minutes per calculation, we will use a random subset of 80 protein structures for this activity to avoid exessively long waits. The full dataset is no longer available on the web and has been replaced by the top2018 dataset.

01 Python and Jupyter Notebooks #
This notebook will introduce you to using Jupyter notebooks and running functions to plot visualize data inside the Jupyter notebook.

02 Biopython and PDB Files #
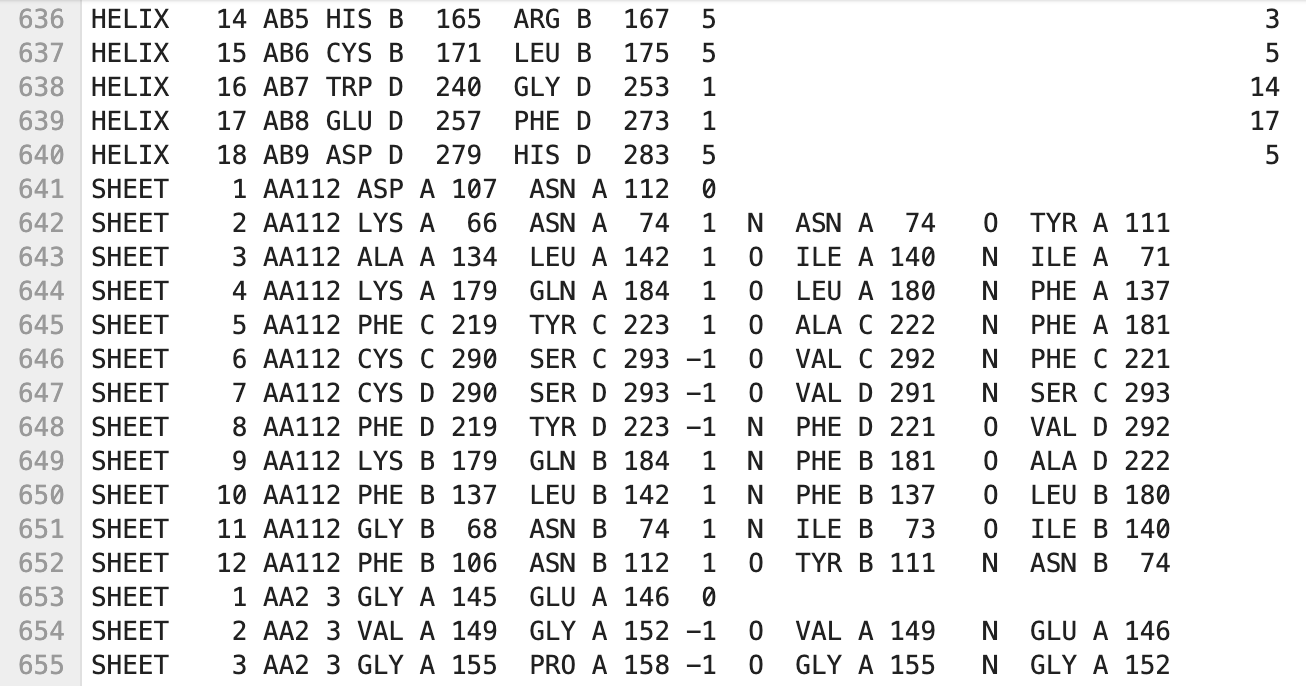
In this notebook, we will start to extract data from PDB files using biopython and visualize them.

03 Angles and Ramachandran Plots #
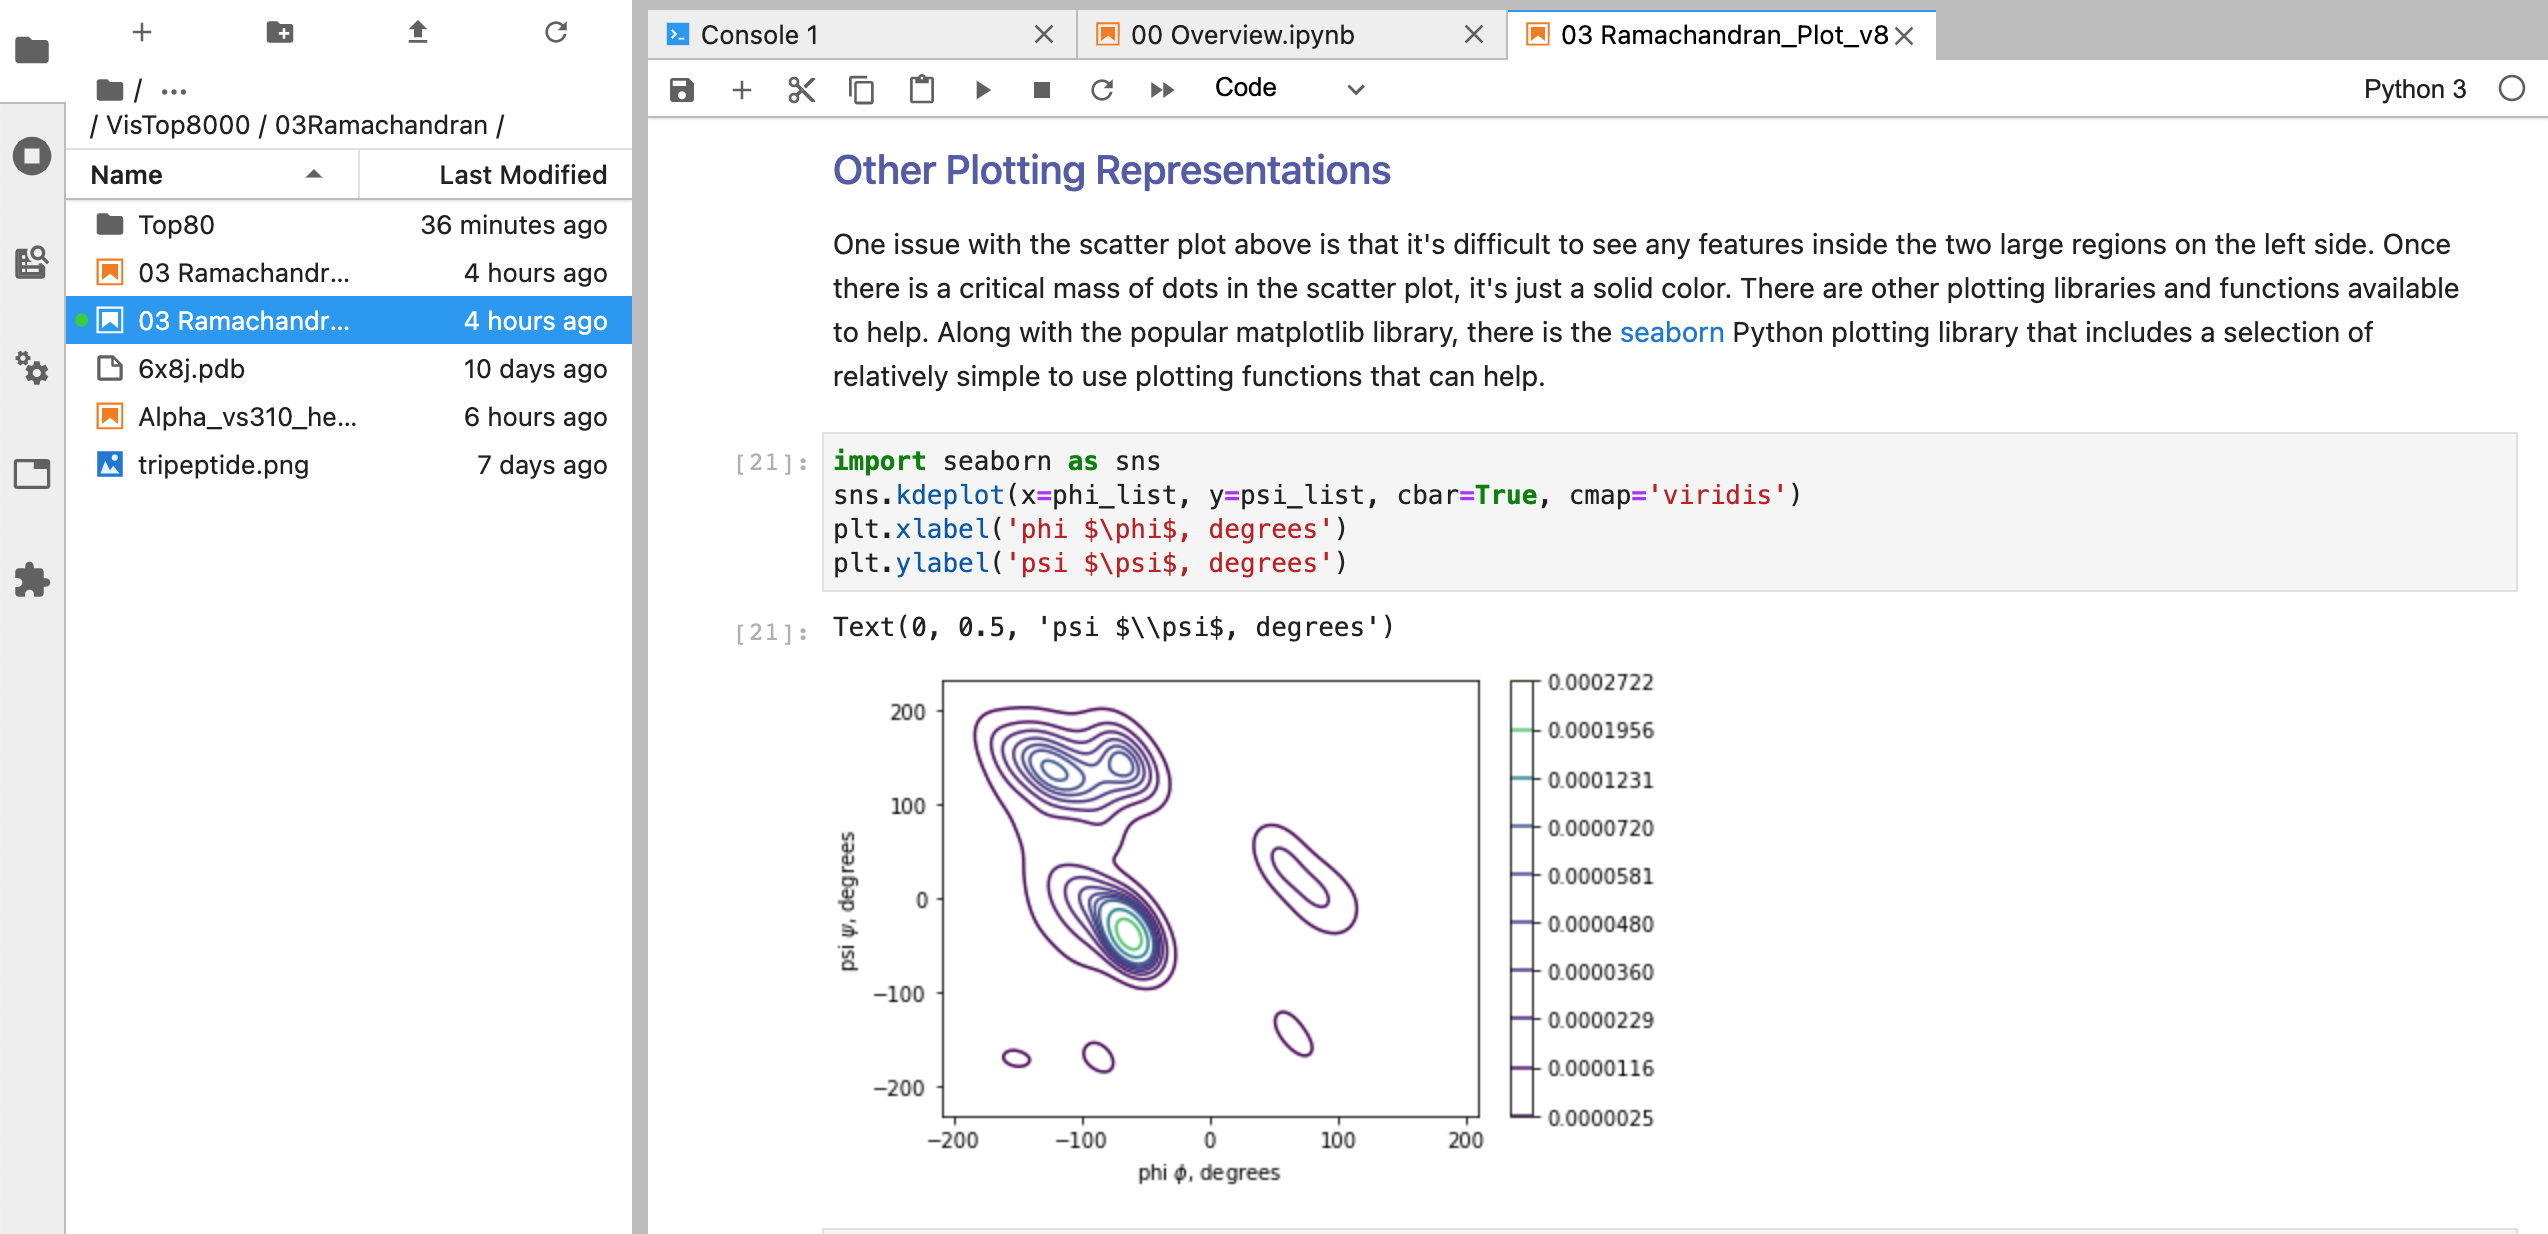
This notebook angle and dihedral angle information from the dataset and plot the result. The goal of this notebook is to answer the question as to whether bond angles in peptide chains follow any patterns.


