Notebook 3: Bond Angles and Ramachandran Plots
Contents
Notebook 3: Bond Angles and Ramachandran Plots #
In this Jupyter notebook, you will be introduced to measuring the angles and dihedral angles along the backbond of peptide chains. The goals of this notebook are to:
Measure angles and dihedral angles using biopython
Examine angle distributions using histogram plots
Generate Ramachandran plots by multiple plotting methods
Dihedral angles are torsional angles formed by four adjacent atoms. There are three types of dihedral angles along the peptide backbond designated wiht phi (\(\phi\)), psi (\(\psi\)), and omega (\(\omega\)) as shown below. These angles typically fall within specific ranges due to steric repulsion and bond order. In this notebook, we will explore these typical ranges.

Big question: What are the trends in bond angles in proteins? #
import Bio.PDB
from Bio.PDB.vectors import calc_dihedral, calc_angle

import matplotlib.pyplot as plt
%matplotlib inline
import os

import warnings
from Bio import BiopythonWarning
warnings.simplefilter('ignore', BiopythonWarning)
1. Measure Single Peptide Angles #
The Bio.PDB.vectors module of biopython contains two functions called calc_angle() and calc_dihedral() for calculating conventional angles or dihedral angles, respecitely, along the backbond of a peptide. These function take the vector coordinates (xyz) of the three or four atoms that define the angle or dihedral angle.
calc_angle(<vector>, <vector>, <vector>)

calc_dihedral(<vector>, <vector>, <vector>, <vector>)
The vectors can be otained from the residues using the get_vector() function.
For example, let’s say we want to know the C-N-C\(_\alpha\) angle. The first block of code loads a PDB file and grabs the first amino acid residue of the first chain of the 6x8j.pdb structure.
Be sure to run this code cell! #
parser = Bio.PDB.PDBParser()
structure = parser.get_structure('6x8j', '6x8j.pdb')

chain_A = structure[0]['A']
res = chain_A[58]
Next, we will obtain the coordinate vectors for the carbon, nitrogen, and \(\alpha\)-carbon of an amino acid residue and attach them to variables N, CA, and C, respectively. This is done by identifying the specific atom and using the get_vector() function as described in the previous Jupyter notebook.
Finally, these three vectors are fed into the calc_angle() function which returns the angle in radians.
C = res['C'].get_vector()
N = res['N'].get_vector()
CA = res['CA'].get_vector()

ang = calc_angle(N, CA, C)
ang
1.9625051493089707
Practice: Find Angle in Degrees #
Copy and paste the code from the above code cell and modify it to find the angle of the C\(_\alpha\)-C-O bond. The oxygen in the aminoacid residue is designated by ['O'].
If you have time, convert the output from radiants \(\rightarrow\) degrees.
C = res['C'].get_vector()
CA = res['CA'].get_vector()
O = res['O'].get_vector()

ang = calc_angle(CA, C, O)
ang
2.086180584850502
ang * (180 / 3.14)
119.58996983219437
2. Examine Distributions of Angles #
Let’s now examine the distribution of the omega (\(\omega\)) bond angles using a histogram plot. In the code cell below, there is code that defines the Python function get_omega() you can use to measure all the omega dihedral angles.
Run the pre-written code in the following cell. #
# Run this cell to define a function you can use in subsequent cells

def get_abs_omega(file):
    """Return list of absolute value omega dihedral angles in radians"""
    omega_list = []
    parser = Bio.PDB.PDBParser()
    structure = parser.get_structure('protein', file)
    pp = Bio.PDB.PPBuilder().build_peptides(structure[0])
    for chain in pp:
        for res in range(0, len(chain) - 1):
            try:
                # get vectors for this peptide and the N from the subsequent peptide
                CA = chain[res]['CA'].get_vector()
                C = chain[res]['C'].get_vector()
                N_next = chain[res + 1]['N'].get_vector()
                C_next = chain[res + 1]['CA'].get_vector()
                omega = calc_dihedral(CA, C, N_next, C_next) * (180 / 3.14159)
                omega_list.append(abs(omega))
            except KeyError:
                continue
    return omega_list
Now you will use the function in the following cell. Place the name of a PDB file in quotes inside the parentheses, and the function will return a list of omega dihedral angles in degrees.
Example:
get_abs_omega('5grt.pdb')
Practice: Plot Omega Angle Distribution #
Run the
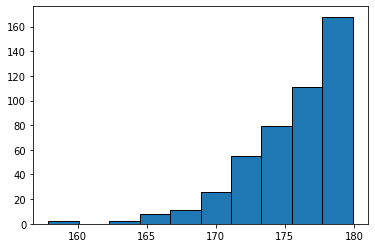
get_abs_omega()function below for the 6x8j.pdb protein. You will also want to assign this list of angles to a variable for later use.Plot the distribution of omega angles using the
plt.hist()histogram plot function. See the first Jupyter notebook if you need review.What do you notice about the distribution? What is the strucutral reason for this? Write you answer in a markdown cell below. Hint: the omega angle is centered on the peptide amide bond.
omega = get_abs_omega('6x8j.pdb')
plt.hist(omega, bins=10, edgecolor='black')
plt.show()
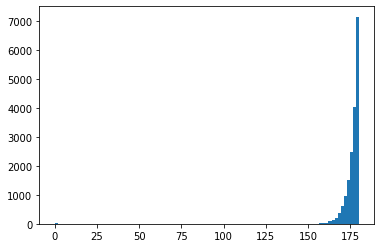
omega = []

import os
path, _ = os.path.split(os.getcwd())
top80 = os.path.join(path, 'Top80')

for file in os.listdir(top80):
    if file.endswith('pdb'):
        omega.extend(get_abs_omega(os.path.join(top80,file)))
plt.hist(omega, bins=100)
plt.show()
3. Ramachandran Plots from Single Protein #
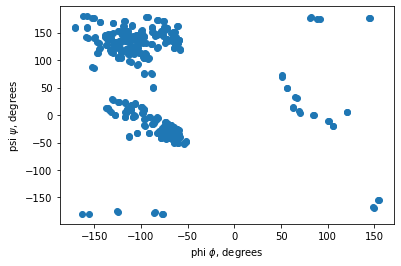
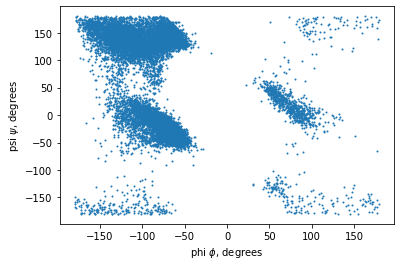
A Ramachandran plot is a 2D plot of the psi (\(\psi\)) versus the phi (\(phi\)) dihedral angles. Below is a function that takes the file name of a PDB file and returns two lists: a list of phi and and list of psi angles.
e.g., ramachandran('1abc.pdb') -> [phi], [psi]
def ramachandran(PDB):
    """Accepts a PDB file name (string) and returns two lists of phi
    and psi angles, respectively.
    """
    parser = Bio.PDB.PDBParser()
    structure = parser.get_structure('protein', PDB)
    polypeptide = Bio.PDB.PPBuilder().build_peptides(structure[0])

    phi = []
    psi = []

    for strand in polypeptide:
        phipsi = strand.get_phi_psi_list()
        for point in phipsi:
            try:
                phi_point = point[0] * (180 / 3.14159)
                psi_point = point[1] * (180 / 3.14159)
                phi.append(phi_point)
                psi.append(psi_point)
            except TypeError:
                pass

    return phi, psi
Let’s run the ramachandran function with a single 6x8j.pdb protein file and plot the result in a scatter(x,y) plot.
phi, psi = ramachandran('6x8j.pdb')

plt.scatter(phi, psi)
plt.xlabel('phi $\phi$, degrees')
plt.ylabel('psi $\psi$, degrees')
Text(0, 0.5, 'psi $\\psi$, degrees')
4. Ramachandran Plots from Multiple Top8000 Proteins #
We will now collect data on a larger number of PDB files and plot the result. You have been provided a folder containing a few PDB files from the Top8000 dataset. Calculating the phi and psi angles for all 8000 often requires at least a few minutes of computer time, so for the sake of time, we will only work with a subset of this dataset. You can download the full dataset from http://kinemage.biochem.duke.edu/databases/top8000.php if you wish to use the full dataset at a later date.
import os
path, _ = os.path.split(os.getcwd())
top80 = os.path.join(path, 'Top80')
phi_list = []
psi_list = []

for file in os.listdir(top80):
    if file.endswith('pdb'):
        phi, psi = ramachandran(os.path.join(top80,file))
        phi_list.extend(phi)
        psi_list.extend(psi)
plt.scatter(phi_list, psi_list, s=1)
plt.xlabel('phi $\phi$, degrees')
plt.ylabel('psi $\psi$, degrees')
Text(0, 0.5, 'psi $\\psi$, degrees')
Other Plotting Representations #
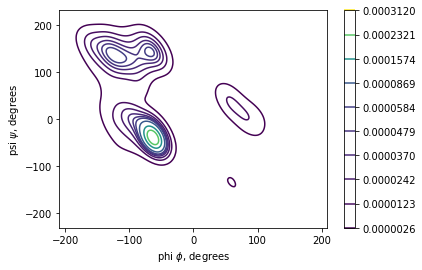
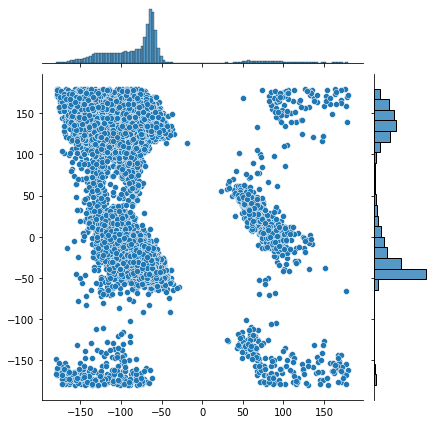
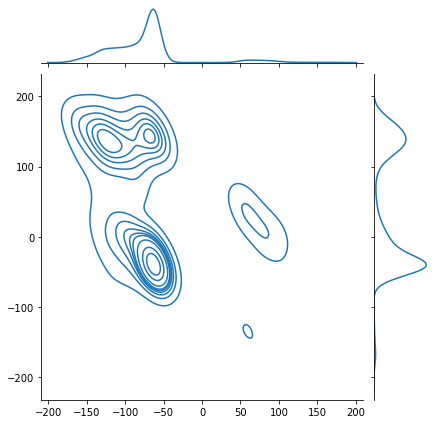
One issue with the scatter plot above is that it’s difficult to see any features inside the two large regions on the left side. Once there is a critical mass of dots in the scatter plot, it’s just a solid color. There are other plotting libraries and functions available to help. Along with the popular matplotlib library, there is the seaborn Python plotting library that includes a selection of relatively simple to use plotting functions that can help.
import seaborn as sns
sns.kdeplot(x=phi_list, y=psi_list, cbar=True, cmap='viridis')
plt.xlabel('phi $\phi$, degrees')
plt.ylabel('psi $\psi$, degrees')
<frozen importlib._bootstrap>:228: RuntimeWarning: scipy._lib.messagestream.MessageStream size changed, may indicate binary incompatibility. Expected 56 from C header, got 64 from PyObject
Text(0, 0.5, 'psi $\\psi$, degrees')
sns.jointplot(x=phi_list, y=psi_list)
<seaborn.axisgrid.JointGrid at 0x7fb41577ae20>
sns.jointplot(x=phi_list, y=psi_list, kind='kde')
<seaborn.axisgrid.JointGrid at 0x7fb418c02d60>
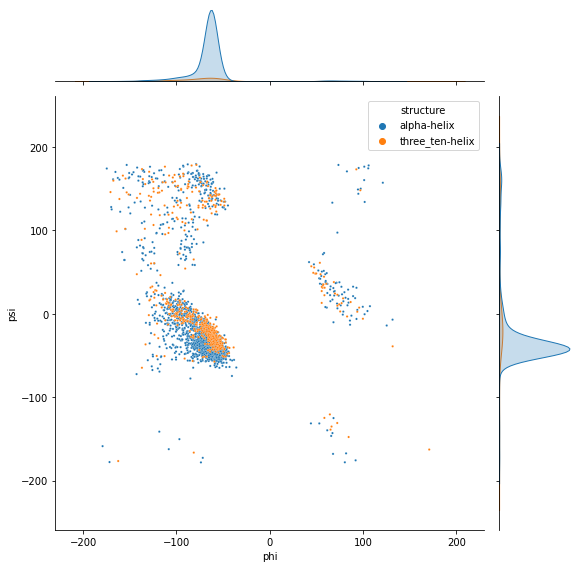
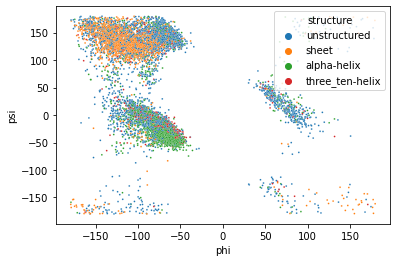
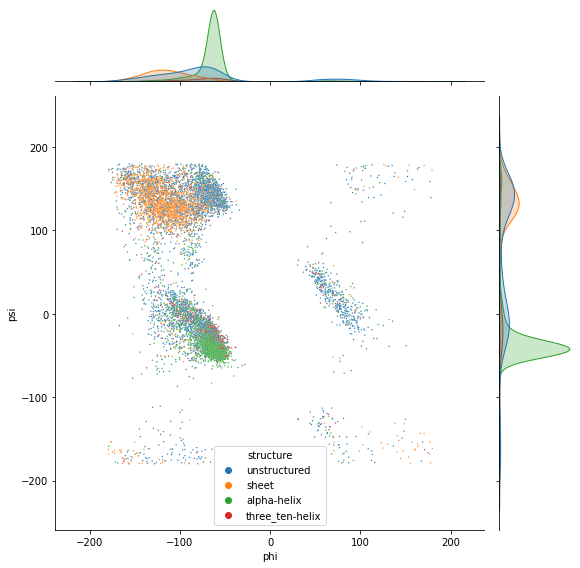
Practice: Plotting Ramachandrans Plots with Secondary Structure #
For a little extra practice, let’s visualize how the presencen of helix and sheet secondary structures affects the phi and psi angles. Run the following two code cells to harvest a the phi and psi angles from your 80 protein dataset, but this time, it will also record if each amino acid residue is unstructured, in a helix, or in a sheet. Note: helicies in this dataset are a mixture of \(\alpha\)-helicies or \(3_{10}\)-helicies
def get_secondary_list(file):
    '''(string) -> ([list], [list])

    Accepts a PDB file name (string) and returns two lists of residues
    contained inside helicies and sheets, respetively. The residues are
    strings containing the chain identifies and residue number

    >>> ('1abc.pdb') -> [['A34', 'A35', 'A36'], ['A74', 'A75', 'A93', 'A94']]
    '''

    alpha = []
    three_ten = []
    sheets = []

    with open(file, 'r') as f:
        for line in f:
            if line.startswith('HELIX'):
                chain = line[19:20]
                start = line[21:25].strip()
                stop = line[33:37].strip()

                if line[39:40] == '1':
                    for res in range(int(start), int(stop) + 1):
                        alpha.append(chain + str(res))
                if line[39:40] == '5':
                    for res in range(int(start), int(stop) + 1):
                        three_ten.append(chain + str(res))

            if line.startswith('SHEET'):
                chain = line[21:22]
                start = line[22:26].strip()
                stop = line[33:37].strip()

                for res in range(int(start), int(stop) + 1):
                    sheets.append(chain + str(res))

    return alpha, three_ten, sheets

def get_phi_psi_sec_list(file):
    """Return list of absolute value omega dihedral angles in radians"""

    alpha, three_ten, beta = get_secondary_list(file)

    phi_psi_structure = []

    parser = Bio.PDB.PDBParser()
    structure = parser.get_structure('protein', file)

    for chain in structure[0]:
        # get chain ID and residue numbers
        ID = chain.get_id()
        seq_ID = [residue.get_id()[1] for residue in chain]

        pp = Bio.PDB.PPBuilder().build_peptides(chain)[0]

        for res in range(1, len(pp) - 1):
            res_ID = ID + str(seq_ID[res])
            #print(res_ID)
            try:
                # get vectors for this peptide and the N from the subsequent peptide

                C_prev = pp[res - 1]['C'].get_vector()
                CA = pp[res]['CA'].get_vector()
                C = pp[res]['C'].get_vector()
                N = pp[res]['N'].get_vector()
                N_next = pp[res + 1]['N'].get_vector()
                phi = calc_dihedral(C_prev, N, CA, C) * (180 / 3.14159)
                psi = calc_dihedral(N, CA,C, N_next) * (180 / 3.14159)

                if res_ID in alpha:
                    structure = 'alpha-helix'
                elif res_ID in three_ten:
                    structure = 'three_ten-helix'
                elif res_ID in beta:
                    structure = 'sheet'
                else:
                    structure = 'unstructured'

                phi_psi_structure.append([phi, psi, structure])


            except KeyError:
                print('Key Error!')

        return phi_psi_structure
phi_psi_sec = []

path, _ = os.path.split(os.getcwd())
top80 = os.path.join(path, 'Top80')

for file in os.listdir(top80):
    if file.endswith('pdb'):
        phi_psi_sec.extend(get_phi_psi_sec_list(os.path.join(top80,file)))
import pandas as pd
df = pd.DataFrame(data=phi_psi_sec, columns=['phi','psi', 'structure'])
df
| phi | psi | structure | |
|---|---|---|---|
| 0 | -68.530484 | 125.694719 | unstructured |
| 1 | 80.751198 | -9.201992 | unstructured |
| 2 | -86.457910 | 125.645406 | unstructured |
| 3 | -92.169453 | 124.810233 | sheet |
| 4 | -92.425998 | 124.451491 | sheet |
| ... | ... | ... | ... |
| 10701 | -156.491897 | 154.145583 | sheet |
| 10702 | -81.622179 | 131.701232 | sheet |
| 10703 | -135.036157 | 159.961719 | sheet |
| 10704 | -123.924712 | 148.635385 | sheet |
| 10705 | -104.225346 | 156.041438 | unstructured |
10706 rows × 3 columns
Now let’s plot the data using the seaborn plotting library which contains an assortment of ploting functions that produce more complex plots with relatively few lines of code.
sns.scatterplot(x=df['phi'], y=df['psi'], hue=df['structure'], s=3)
<AxesSubplot:xlabel='phi', ylabel='psi'>
sns.jointplot(x=df['phi'], y=df['psi'], hue=df['structure'], s=2, height=8)
<seaborn.axisgrid.JointGrid at 0x7fb41774ad60>
df_alpha = df[df['structure'] == 'alpha-helix']
df_310 = df[df['structure'] == 'three_ten-helix']

df_helix = pd.concat((df_alpha, df_310))
sns.jointplot(x=df_helix['phi'], y=df_helix['psi'], hue=df_helix['structure'], s=5, height=8)
<seaborn.axisgrid.JointGrid at 0x7fb41a638910>
